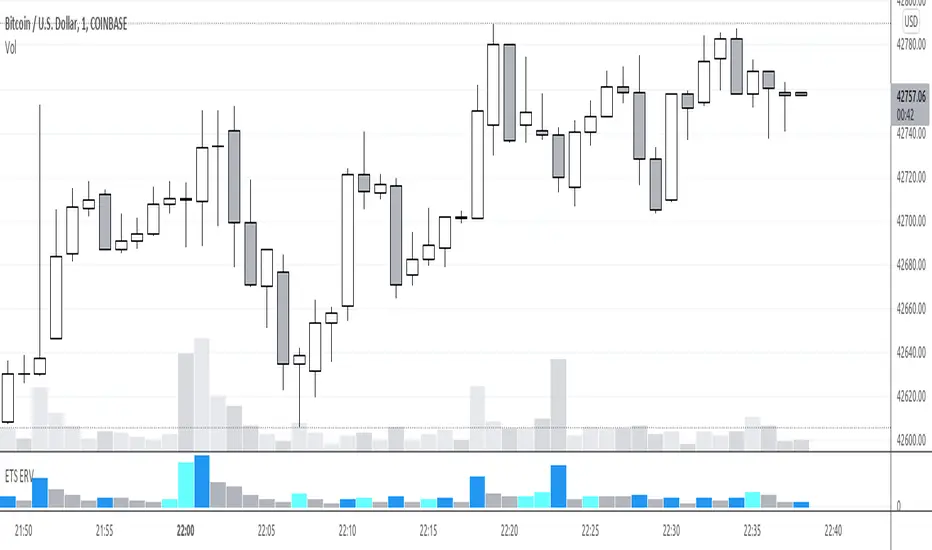
Early Relative Volume"Buy or Sell when you see a spike in volume" is advice that you often hear, the problem for me was that you only find out that volume is spiking after the fact. So that's why I created the Early Relative Volume indicator.
The Early Relative Volume indicator takes the amount of time that has passed for the current bar, let's say 10 seconds, and compares the volume of that first 10 seconds to the average volume in 10 seconds of the previous candle.
That means that it will tell you if the volume thus far in the current candle is more or less than the relative volume of the previous candle, so that you can potentially get an indication that the volume of the current candle is going to be greater or less than the previous candle.
This approach is of course not perfect, and obviously the values update as the current candle progresses, but I've found it useful to identify early breakout candles.
There is also an option to do the same calculation with the size of the body of the candle, by enabling the "Blue bars if candle body and volume bigger" option. It will only turn blue of both the volume and the size of the candle's body is calculated to be bigger.
I hope this helps you in your trading!
Cerca negli script per "volume indicator"
On Balance VolumeEnhanced the original OBV (On Balance Volume) indicator:
- Draw max lines of OBV in the last 30 candles so that we can notice the trend, as well as divergences easier.
- If you use fiat as base currency (USDT in cryptocurrency for example), we can display the OBV in fiat, so that we can compare total trading volume across a list of symbols to find healthy symbols to trade easier.

Volume Play This is going to be my first published indicator on Trading View. Thanks for TradingView for providing us this great platform And thanks for all of those who helps me to built this indicator and share there ideas.I cannot mention everyone name here believe me that list going to be huge.Everyone’s idea and help is much appreciated.This is how our TradingView community is growing day by day with kindness and knowledge. Every time I take so much from community in form knowledge that every time somewhere I feel that I also need to do something for community and finally day arrived .A gift from my side to community.A gift of indicator-VOLUME PLAY
This volume based indicator has High Relative Volume bar Background, Low Relative Volume bar background ,Volume Labels of Buying volume, Selling volume and Total volume count with percentage, Highest Volume in Percentage and Highest 5x volume count and 10x volume count of bar.Plus I have did column scaling to take Down pan input so you can switch pane or add in existing pane without any major problem And all this works on any time frame. Isn’t it good idea?
This indicator displays the volume of each session in a similar manner of the default volume indicator.However it add on the last bar Green and Red bar colours. Green means buying is more than selling and Red means selling is more than buying.On top of Some bar If number appears That means that’s volume is highest multiple volume of 5 and if number appears with label means highest multiple volume of 10.So simple without label volume counts means 5x and with label means 10x.
Now some of bars has background colour of Mint green , Pastel red and White.That’s highlight high relative volume bars with a highly buying activity range in Green and high relative volume bars with a highly selling activity range in Red And white background is low relative volume for that timeframe bar.
I am kind of person who don’t keep show indicator value enable all time.So it’s come in mind why not plot this values without enabling it.So I decided to show this values of buying, selling and total volumes on top near middle pane.Interesting thing is that I made a label with the help of pine script Table feature.Thanks a lot to Pine Team to add this new great feature! It’s great alternative for labels feature.Because of this feature I am able to locate buying, selling and total volume at right place where in most of scenario it will adjust.
Please note that all values are estimate.It’s not accurate.I show volumes in K,M form.Plus with volume I also try to show Buying And Selling volume in percentage form to get rough idea about what’s going on in instrument.Idea is to get better view of volume by splitting it into Buying , Selling and Total volume.This allows you to see are the bulls or bears in-control in relation to the overall Volume.
By default this indicator overlay is false but you can move this indicator pane to existing upper or lower pane.It will help to save space as well.If combine with two indicator at same pane then it will create two value scale at right side.So you will not loose any indicators values.By default I used 50% of vertical space in indicator scale factor.
I tried to make this indicator as accurate as inbuilt volume indicator with added extra feature.The main aim of indicator to get Idea of volume role in that symbol with that specific timeframe.Result might not be accurate but I expect somewhat nearby to accurate.
Kept source code open purposely for learners of pine script. Please avoid misuse or selling of this indicator.Remember Sharing Is Caring. If someone has suggestions or any addition then please comment below.Wishing you all abundance of health, wealth, and prosperity.
After all its all about VOLUME PLAY.
Disclaimer:-This indicator is not meant for buy or sell signals.This post and the script don’t provide any financial advice. This indicator/code IS NOT intended to be a formal investment advice or recommendation by the author, nor should be construed as such. Users will be fully responsible by their use regarding their own trading vehicles/assets.

Volume Profile [Makit0]VOLUME PROFILE INDICATOR v0.5 beta
Volume Profile is suitable for day and swing trading on stock and futures markets, is a volume based indicator that gives you 6 key values for each session: POC, VAH, VAL, profile HIGH, LOW and MID levels. This project was born on the idea of plotting the RTH sessions Value Areas for /ES in an automated way, but you can select between 3 different sessions: RTH, GLOBEX and FULL sessions.
Some basic concepts:
- Volume Profile calculates the total volume for the session at each price level and give us market generated information about what price and range of prices are the most traded (where the value is)
- Value Area (VA): range of prices where 70% of the session volume is traded
- Value Area High (VAH): highest price within VA
- Value Area Low (VAL): lowest price within VA
- Point of Control (POC): the most traded price of the session (with the most volume)
- Session HIGH, LOW and MID levels are also important
There are a huge amount of things to know of Market Profile and Auction Theory like types of days, types of openings, relationships between value areas and openings... for those interested Jim Dalton's work is the way to come
I'm in my 2nd trading year and my goal for this year is learning to daytrade the futures markets thru the lens of Market Profile
For info on Volume Profile: TV Volume Profile wiki page at www.tradingview.com
For info on Market Profile and Market Auction Theory: Jim Dalton's book Mind over markets (this is a MUST)
BE AWARE: this indicator is based on the current chart's time interval and it only plots on 1, 2, 3, 5, 10, 15 and 30 minutes charts.
This is the correlation table TV uses in the Volume Profile Session Volume indicator (from the wiki above)
Chart Indicator
1 - 5 1
6 - 15 5
16 - 30 10
31 - 60 15
61 - 120 30
121 - 1D 60
This indicator doesn't follow that correlation, it doesn't get the volume data from a lower timeframe, it gets the data from the current chart resolution.
FEATURES
- 6 key values for each session: POC (solid yellow), VAH (solid red), VAL (solid green), profile HIGH (dashed silver), LOW (dashed silver) and MID (dotted silver) levels
- 3 sessions to choose for: RTH, GLOBEX and FULL
- select the numbers of sessions to plot by adding 12 hours periods back in time
- show/hide POC
- show/hide VAH & VAL
- show/hide session HIGH, LOW & MID levels
- highlight the periods of time out of the session (silver)
- extend the plotted lines all the way to the right, be careful this can turn the chart unreadable if there are a lot of sessions and lines plotted
SETTINGS
- Session: select between RTH (8:30 to 15:15 CT), GLOBEX (17:00 to 8:30 CT) and FULL (17:00 to 15:15 CT) sessions. RTH by default
- Last 12 hour periods to show: select the deph of the study by adding periods, for example, 60 periods are 30 natural days and around 22 trading days. 1 period by default
- Show POC (Point of Control): show/hide POC line. true by default
- Show VA (Value Area High & Low): show/hide VAH & VAL lines. true by default
- Show Range (Session High, Low & Mid): show/hide session HIGH, LOW & MID lines. true by default
- Highlight out of session: show/hide a silver shadow over the non session periods. true by default
- Extension: Extend all the plotted lines to the right. false by default
HOW TO SETUP
BE AWARE THIS INDICATOR PLOTS ONLY IN THE FOLLOWING CHART RESOLUTIONS: 1, 2, 3, 5, 10, 15 AND 30 MINUTES CHARTS. YOU MUST SELECT ONE OF THIS RESOLUTIONS TO THE INDICATOR BE ABLE TO PLOT
- By default this indicator plots all the levels for the last RTH session within the last 12 hours, if there is no plot try to adjust the 12 hours periods until the seesion and the periods match
- For Globex/Full sessions just select what you want from the dropdown menu and adjust the periods to plot the values
- Show or hide the levels you want with the 3 groups: POC line, VA lines and Session Range lines
- The highlight and extension options are for a better visibility of the levels as POC or VAH/VAL
THANKS TO
@watsonexchange for all the help, ideas and insights on this and the last two indicators (Market Delta & Market Internals) I'm working on my way to a 'clean chart' but for me it's not an easy path
@PineCoders for all the amazing stuff they do and all the help and tools they provide, in special the Script-Stopwatch at that was key in lowering this indicator's execution time
All the TV and Pine community, open source and shared knowledge are indeed the best way to help each other
IF YOU REALLY LIKE THIS WORK, please send me a comment or a private message and TELL ME WHAT you trade, HOW you trade it and your FAVOURITE SETUP for pulling out money from the market in a consistent basis, I'm learning to trade (this is my 2nd year) and I need all the help I can get
GOOD LUCK AND HAPPY TRADING

Volume/Rsi Overbought/oversoldI present you my last indicator. A volume indicator that indicates overbought and oversold based on the rsi, I chose the rsi because the most used surment, this indicator allows you to identify the overbought and oversold areas of the rsi with the colors blue (oversold) and orange (overbought ) on the volume indicator! Hoping that you are useful
VPT_OBVThis is a derivation of the On Balance Volume Indicator.
The idea behind it is that volume consists of two parts. The driving theory is the basic law of supply and demand.
Part 1: Volume consists of shares traded at an equilibrium price. An equal number of buyers and sellers are present during this volume. This area is displayed as the upper and lower shadows on a single candlestick. For this indicator, volume traded in equilibrium is not included in the display.
Part 2: Volume consists of shares that are not traded at an equilibrium price, driving price up or down for the time period. In this volume, buyers or sellers are not present in equal numbers. This area is displayed as the body of the candlestick. This indicator focuses on this part of volume.
VPT_OBV plots only the volume that occurs at the difference in price between the open and the close. To achieve this, volume is divided by the difference between the high and the low (in pennies). Next, the difference between the open and close is calculated (in pennies). Volume is then divided by the difference in the high and low, to get the amount of volume needed to move the asset up or down by $0.01 during the time period. This number is then multiplied by the difference between the open and close.
VPT_OBV plots the outcome as a cumulative total. A simple moving average of the VPT_OBV is thrown in to provide smoothing.

[COG] Platypus Platypus
Overview
Platypus is a volume momentum indicator that combines price action, volume analysis, and multi-timeframe confirmation to generate trade signals. Unlike traditional volume indicators, Platypus reconstructs volume momentum by factoring in price velocity, volatility adjustment, and market structure to identify true institutional momentum shifts.
The indicator features a comprehensive filtering system including EMA alignment, background state confirmation, and optional multi-timeframe filters to eliminate false signals and ensure you only trade with the strongest momentum.
Key Features
✅ Volume Momentum Calculation
Volatility-Adjusted Volume: Normalizes volume relative to recent volatility periods
Quiet Market Filtering: Reduces noise during low-activity periods
Spike Detection: Identifies abnormal volume surges with boosted weighting
Momentum Smoothing: EMA-based smoothing prevents erratic signals
✅ Entry Pattern Detection
3-Bar Pattern Requirement: RED → GREEN → GREEN for buys (opposite for sells)
State Management: Prevents consecutive signals in same direction without reset
Background Confirmation: Must align with bullish/bearish market state
EMA Alignment Filter: Ensures trend structure supports the trade direction
✅ Multi-Timeframe Filtering System
HTF Closed Bar Filter: Confirms last closed higher timeframe bar matches direction (no repaint)
HTF Momentum Filter: Requires current HTF bar to match direction (live, prevents delayed entries)
Dual-Filter Capability: Use both filters for maximum precision
✅ Dashboard
Real-time Status Monitoring: Volume trend, background state, EMA order, trade state
Filter Status Display: Shows HTF filter conditions and signal permission
Pattern Detection: Indicates when 3-bar entry pattern is forming
✅ On-Chart Integration
50/100/200 EMAs: Automatically plotted on price chart with customizable colors
Visual Entry Markers: Triangle signals appear on price chart at entry points
Signal Alerts: Built-in alert conditions for all signal types
📚 Core Settings Explained
signalPeriod = input.int(8, "Signal Period", minval=1, group="Core Settings")
Signal Period (Default: 8): Controls the smoothing of the signal line (blue line). Lower values = more responsive, higher values = smoother but slower to react.
volatilityPeriod = input.int(20, "Volatility Period", minval=1, group="Core Settings")
Volatility Period (Default: 20): Lookback period for volume and price range calculations. This period is used to normalize volume relative to recent market conditions.
priceFilterLength = input.int(200, "Price Filter MA Length", minval=1, group="Core Settings")
Price Filter MA Length (Default: 200): The SMA period used for background state determination. Price must be above this MA for bullish background, below for bearish background.
Advanced Settings
momentumMultiplier = input.float(50.0, "Momentum Multiplier", minval=20.0, maxval=80.0, step=2.0, group="Advanced")
Momentum Multiplier (Default: 50.0): Scales the final momentum score. Higher values = larger histogram bars and more sensitivity. Adjust based on your instrument's volatility.
momentumSmoothing = input.int(4, "Momentum Smoothing", minval=1, maxval=15, group="Advanced")
Momentum Smoothing (Default: 4): EMA period applied to raw momentum before normalization. Higher values reduce noise but add lag.
quietThreshold = input.float(0.3, "Quiet Market Filter", minval=0.0, maxval=1.0, step=0.05, group="Advanced")
Quiet Market Filter (Default: 0.3): During low-volume periods, this applies exponential dampening to momentum. Higher values = more aggressive filtering of weak moves.
volStrengthFactor = volRatio < (1.0 + quietThreshold) ? math.pow(volRatio, 2) : volRatio
When volume is less than average + threshold, it squares the ratio (dampening), otherwise uses linear scaling.

Luminous Volume Flow [Pineify]Luminous Volume Flow
The Luminous Volume Flow is a specialized volume-based momentum oscillator designed to uncover the underlying buying and selling pressure within the market. Unlike traditional volume indicators that simply aggregate volume based on the close relative to the open, LVF analyzes intrabar dynamics—specifically the relationship between the close price and the high/low wicks—to estimate the dominance of buyers or sellers.
By smoothing this raw volume delta and applying a signal line, the LVF provides a clear visual representation of volume flow, helping traders identify trend strength, potential reversals, and momentum shifts with high-definition "luminous" visuals.
Key Features
Intrabar Pressure Analysis : Calculates buying and selling pressure based on wick dynamics and price polarity to provide a more granular view of market sentiment.
Multi-Type Smoothing : Offers selectable Moving Average types (SMA, EMA, RMA) for the main Flow Line to adapt to different market volatilities.
Luminous Visuals : Utilizes dynamic color gradients that brighten as momentum expands and darken as it contracts, offering immediate visual feedback on trend intensity.
Sentiment Cloud : Fills the area between the Flow and Signal lines to clearly visualize the prevailing bullish or bearish sentiment.
High-Contrast Signals : Optional high-contrast signal markers for clear crossover identification.
How It Works
The LVF operates on a multi-stage calculation process:
Pressure Calculation : The script compares the lower wick (Close - Low) against the upper wick (High - Close).
If the lower wick is longer, it suggests buying pressure (rejection of lower prices), and volume is assigned to Buy Pressure .
If the upper wick is longer, it suggests selling pressure (rejection of higher prices), and volume is assigned to Sell Pressure .
If equal, the Close > Open polarity is used as a tie-breaker.
Raw Delta : The difference between Buy and Sell Pressure is calculated to determine the net volume flow for the bar.
Flow Line : The Raw Delta is smoothed using a user-selected Moving Average (SMA, EMA, or RMA) over the Flow Length period. This creates the main oscillator line.
Signal Line : An EMA of the Flow Line is calculated to generate the Signal Line, similar to the MACD mechanic.
Histogram : The difference between the Flow Line and Signal Line determines the Histogram, which drives the "Luminous" color gradient logic.
Trading Ideas and Insights
Trend Confirmation : When the Flow Line is above the Signal Line and the Cloud is green, the bullish trend is supported by volume. Conversely, a red cloud indicates bearish volume dominance.
Momentum Crossovers : The triangle shapes indicate crossovers between the Flow and Signal lines. A triangle up (Green) suggests a potential bullish entry or invalidation of a short bias. A triangle down (Red) suggests a bearish turn.
Expansion vs. Contraction : Pay attention to the brightness of the histogram columns. Bright colors indicate expanding momentum (a strong move), while darker, fading colors suggest the move is losing steam, potentially preceding a consolidation or reversal.
How multiple components work together
This script combines the logic of Volume Delta analysis with Signal Line Crossover mechanics (popularized by MACD). By applying trend-following smoothing to raw volume data, we transform erratic volume spikes into a coherent flow. The "Luminous" visual layer is added to make the data interpretation intuitive—removing the need to mentally calculate the rate of change based on histogram height alone.
Unique Aspects
Adaptive Gradient Coloring : The histogram doesn't just show positive/negative values; it visually communicates the *acceleration* of the move via color intensity based on standard deviation.
Wick-Based Volume Attribution : Instead of a binary close-to-open comparison, LVF respects the price action within the candle (the wicks), acknowledging that a long lower wick on a red candle can actually represent significant buying interest.
How to Use
Add the indicator to your chart.
Adjust the Flow Length to match your trading timeframe (lower for scalping, higher for swing trading).
Select your preferred Smoothing Type (EMA is default and recommended for responsiveness).
Use the "Sentiment Cloud" filter: Look for long signals only when the cloud is green, and short signals when the cloud is red.
Monitor the Luminous Histogram for signs of exhaustion (colors fading) to manage exits.
Customization
Flow Length : Period for the main smoothing (Default: 14).
Signal Length : Period for the signal line (Default: 9).
Smoothing Type : Choose between SMA, EMA, or RMA.
Colors : Fully customizable colors for Bullish/Bearish phases and signals.
Chart Bars : Option to color the main chart candles based on the Flow direction.
Conclusion
The Luminous Volume Flow is a robust tool for traders who want to go beyond price action and understand the volume dynamics driving the market. By visualizing the flow of buying and selling pressure with advanced smoothing and reactive visuals, it provides a clearer picture of market sentiment than standard volume bars.

Institutional Flow DetectorOverview
InstFlow 1S Delta identifies institutional order flow by analyzing volume anomalies and directional bias using 1-second sub-bar data. The indicator detects when large players are likely entering or exiting positions, providing actionable trade recommendations with confidence scoring.
Unlike traditional volume indicators that only show total volume, InstFlow breaks down each bar into 1-second micro-bars, classifies buying vs selling pressure, and identifies statistically significant volume events that likely represent institutional activity.
How It Works
1-Second Delta Analysis
The indicator fetches all 1-second bars within each candle and classifies each micro-bar as buying (close ≥ open) or selling (close < open). This achieves ~85-90% directional accuracy compared to ~55-65% from traditional bar-based methods.
Delta = Buy Volume - Sell Volume
Delta Ratio = |Delta| / Total Volume
Volume Anomaly Detection (Z-Score)
Volume is compared to a rolling 20-bar average using statistical z-scores:
- T1: Z-Score ≥ 1.5 (top ~7% of volume bars)
- T2: Z-Score ≥ 2.0 (top ~2% of volume bars)
- T3: Z-Score ≥ 3.0 (top ~0.1% of volume bars)
Signal Types
- Big Trades (T1/T2/T3) : Unusual volume with clear directional bias
- Absorption (ABS) : High volume + small price move + delta imbalance = hidden liquidity absorbing orders
- Exhaustion (EXH) : Capitulation pattern - big flush followed by immediate reversal with opposing delta
- Divergence (DIV) : Price and cumulative delta disagreeing over 5 bars
ACTION Recommendation System
Synthesizes all signals into a single trade direction (LONG/SHORT/WAIT) with confidence scoring (1-10):
- Exhaustion signals: +5 points (strongest reversal)
- Counter-trend absorption: +4 points
- Volume tier: +1 to +3 points
- Divergence confirmation: +2 points
- Strong trend (ADX>30): +1 point
- High delta imbalance (>50%): +1 point
Features
Real-time 1-second delta classification for accurate buy/sell detection
Statistical volume anomaly detection adapts to each instrument
Absorption detection finds hidden liquidity/iceberg orders
Exhaustion patterns catch capitulation reversals
Delta divergence warns of weakening moves
ACTION + Confidence system provides clear trade recommendations
Price-locked markers stay fixed at detection level (don't float)
Info table displays all metrics in real-time
RTH session filtering
Comprehensive alert conditions
Settings Guide
Detection Settings
Volume Lookback (20): Bars for calculating average volume and standard deviation
T1/T2/T3 Thresholds : Z-score thresholds for volume tiers. Lower = more signals.
1-Second Delta
Delta Resolution (1S): Use 1S for ES/NQ. Try 5S if 1S unavailable.
Min Delta Imbalance (10%): Minimum ratio to classify direction.
Absorption Detection
Min Volume Multiple (1.2x): Volume must exceed average by this multiple
Max Price Move Multiple (0.5x): Price move must be less than this × average range
Delta Imbalance Threshold (20%): Minimum delta ratio for absorption
Exhaustion Detection
Minimum Tier for Flush (T1): Required volume tier for the flush bar
New High/Low Lookback (10): Bars to check for price extremes
Min Reversal Size (0.3x ATR): Required body size for reversal bar
Divergence Detection
Divergence Lookback (5): Bars to compare price vs cumulative delta
Delta Trend Threshold (0.4): Sensitivity for divergence detection
How to Use
Add to ES, NQ, MES, or MNQ chart (1-5 minute timeframe)
Check 1S Data quality in table (green = 30+ bars = reliable)
Monitor ACTION field for trade direction
Use Confidence score for position sizing: HIGH (7+) = full size, GOOD (5-6) = standard, MED (3-4) = reduced
EXH signals are highest priority reversals
ABS + DIV combination is strong reversal confirmation
T2/T3 with trend are continuation signals
Avoid counter-trend T1/T2 without EXH/ABS/DIV confirmation
Visual Guide
Green circles below bar = Buy pressure (T1 small, T2 medium, T3 large)
Red circles above bar = Sell pressure (T1 small, T2 medium, T3 large)
Purple diamond + "ABS" = Absorption detected
Cyan label + "EXH" = Exhaustion pattern
Orange triangle + "DIV" = Delta divergence
Yellow background = Counter-trend warning
Best Practices
Trade during RTH (9:30am - 4:00pm ET) for most reliable signals
Wait for HIGH or GOOD confidence before full position
Use EXH as primary reversal trigger
Check cumulative delta supports trade direction
Combine with price action and support/resistance levels
Limitations
Requires 1-second data availability (ES, NQ, MES, MNQ have this)
ETH signals less reliable due to lower volume
EMA-based trend lags on sharp reversals
Not suitable for stocks without adjusting parameters significantly
Absorption/Exhaustion patterns may not occur every session
Disclaimer
This indicator is for educational and informational purposes only. It does not constitute financial advice.
Past performance does not guarantee future results
The indicator shows where institutional activity is LIKELY - it does not predict the future
Always conduct your own research and analysis
Never risk more than you can afford to lose
Paper trade any new strategy before using real capital

Aivance Opening Range & Vol FactorAivance Opening Range & Volume Factor
Overview
The Aivance Opening Range & Volume Factor is a comprehensive tool designed for Day Traders and Scalpers who rely on the "Opening Drive" or "Opening Range Breakout" (ORB) strategies.
The first candle of the trading session often sets the tone for the entire day. This indicator not only visualizes the price action of that critical first candle but also contextualizes the Volume to help you determine if there is enough institutional participation to sustain a trend.
Key Features
1. Opening Volume Factor
Unlike standard volume indicators, this tool calculates a specific Volume Factor for the opening candle:
Formula: (Volume of 1st Candle / Total Volume of Previous Day) * 100
Why it matters: A high Volume Factor (thresholds vary significantly depending on the chart timeframe and asset) suggests strong institutional interest immediately at the open. This often increases the probability of a sustained trend day rather than a choppy range day.
2. Automatic Session Detection
No manual time inputs are required.
The indicator uses time("D") to automatically detect the start of the trading day.
RTH vs. ETH: It adapts to your chart settings. If you use "Regular Trading Hours" (RTH), it marks the 09:30 NY open. If you use "Extended Trading Hours" (ETH), it marks the pre-market open.
3. Visual Opening Range
Box & Lines: Draws a box highlighting the High/Low and the Body (Open/Close) of the opening candle.
Extension: Extends support/resistance lines across the session to help identify breakouts or retests of the opening range later in the day.
4. Smart "Pullback" Logic (Optional)
This script includes a unique filter called "Show only on Pullback":
Default (False): The range is drawn immediately when the first candle closes.
Enabled (True): The range is hidden until the market prints a candle in the opposite direction of the opening move.
Strategy: This helps filter out impulsive moves and encourages trading the "retest" or the failure of the initial drive, rather than chasing the first tick.
How to Use
Trend Confirmation: Look for a breakout of the Opening Box combined with a high Volume Factor.
Support/Resistance: Use the extended gray lines (High/Low of the first candle) as key pivot points for stop-losses or entry targets.
Context: Compare the Volume Factor across different days to establish a baseline for your specific asset (e.g., what constitutes "High Volume" for NQ vs. ES vs. AAPL).
Settings
Colors: Fully customizable colors for Long (Bullish) and Short (Bearish) opening ranges.
Volume Factor: Toggle the text label on/off and adjust size/color.
Logic: Toggle the "Pullback" requirement on/off.
Disclaimer: This tool is for informational purposes only and does not constitute financial advice. Always manage your risk.

Relative VolumeSimple relative volume indicator.
Relative Volume (RVOL) on is a technical indicator that compares an asset's current trading volume to its historical average for that specific time of day, helping traders spot unusual activity, confirm trends, or find potential reversals by showing if volume is significantly higher (green/buzzing) or lower (red/flat) than normal. It's popular for intraday analysis, identifying "in-play" tickers, and gauging market conviction.

Nuh's Complete Multi-Timeframe Dashboard v4.0Nuh's Complete Multi-Timeframe Dashboard v4.0 - Unified Power System
Professional Multi-Timeframe Technical Analysis Dashboard
Nuh's Complete Multi-Timeframe Dashboard v4.0 represents a comprehensive trading analysis system that unifies 20 powerful technical indicators across up to 6 customizable timeframes into a single, intelligent dashboard. This advanced indicator combines trend analysis (EMA, Alpha Trend, SuperTrend, ADX, DI), momentum oscillators (RSI, Stochastic RSI, MACD, CCI, Williams %R, WaveTrend, KST), volume indicators (OBV, CMF, Volume Analysis, MFI), and volatility measures (Squeeze Momentum, Bollinger Bands, ATR, Williams VIX Fix) to provide traders with a holistic market perspective. Each indicator can be independently enabled or disabled, allowing complete customization based on your trading strategy and preferences.
The revolutionary Weighted Power System is the core innovation of this dashboard, transforming raw indicator signals into actionable market power scores. Unlike traditional dashboards that simply count bullish or bearish signals, this system applies sophisticated weighting to each indicator based on your chosen preset (Balanced, Trend Focus, Momentum Focus, Volume Focus) or custom weights. It then combines these weighted signals across multiple timeframes—with timeframe-specific weighting for scalping, day trading, or swing trading styles—to calculate an Overall Market Power score. This provides you with clear percentage-based bullish and bearish power readings, eliminating guesswork and enabling confident trade decisions backed by mathematical confluence.
Built for serious traders who demand precision and flexibility, the dashboard features a fully customizable display with 20 indicator rows that can be reordered to match your preferences, color-coded gradient visualization for instant market sentiment recognition, and integrated Wundertrading-compatible alerts for automated trading. The system supports both legacy count-based alerts and modern power-threshold alerts, allowing you to receive notifications when market conditions meet your specified confluence requirements. Whether you're scalping on lower timeframes or swing trading on higher timeframes, this professional-grade tool adapts to your trading style while maintaining clean, readable visualization that won't clutter your charts.

Watchlist Volume Surge AlertOverview
This indicator is designed for traders who monitor large watchlists and need instant notification when a stock is experiencing unusual volume activity relative to its recent history.
Standard volume indicators often include the current day's volume in the average calculation. This causes a problem: if a stock is having a massive breakout, that high volume pulls the average up immediately, making it harder to hit the "relative" threshold.
This script solves that by comparing the current volume against the Simple Moving Average (SMA) of the previous n bars. This ensures a clean baseline and accurate alerts, even during massive volatility.
Key Features
Smart RVOL Calculation: Calculates Relative Volume (RVOL) based on the previous 30 bars (adjustable), ensuring the current breakout doesn't skew the average.
Visual Clarity:
Bars: Normal volume is transparent. Surge volume turns bright Teal (Bullish Close) or Red (Bearish Close).
Background: The indicator panel background highlights when a surge is active, making it impossible to miss when scanning visually.
Data Window: Displays the exact RVOL ratio (e.g., 2.11) in the Data Window for verification.
Watchlist Alert Optimized: Specifically designed to work with TradingView's "Any alert function call" or standard condition alerts across multiple tickers.
How to Set Up Alerts
This script is perfect for setting a single alert on a large watchlist to catch breakouts as they happen.
Add the indicator to your chart.
Go to the Alerts menu and create a new alert.
Condition: Select Watchlist Volume Surge Alert.
Trigger: Select "Once Per Bar".
Note: Using "Once Per Bar" ensures you are notified the moment the volume crosses the threshold during the trading day, rather than waiting for the market to close.
Message: The script includes a dynamic message: "Volume Surge! {{ticker}} volume is {{plot("RVOL Ratio")}}x the average."
Settings
Average Length (Days): The lookback period for the volume average (Default: 30).
Alert Threshold (x Average): The multiple required to trigger an alert (Default: 1.5x).
Note: This works better when you have a watchlist with similar volatility and/or market cap

Delta Manipulation FootprintIntroduction
The Delta Manipulation Footprint indicator highlights significant shifts in volume delta between consecutive candles, helping traders visually identify potential market manipulation or strong buying/selling pressure. By analyzing the difference in buy and sell volume (delta) and its changes over time, this indicator reveals aggressive market behavior often associated with big players.
Key Features
- Calculates the absolute difference of volume delta between candles, maintaining the direction of change.
- Uses a customizable moving average and threshold multiplier to filter meaningful volume shifts.
- Colors candles green when delta difference is notably increasing, and red when decreasing, for clear visual signals.
- Fully overlays the main price chart, painting candles directly for intuitive interpretation.
How to Use
Apply this indicator to your price chart to instantly visualize periods of significant volume delta shifts. Look for green candles signaling rising buying pressure and red candles showing increasing selling pressure. Adjust the moving average length and threshold multiplier inputs to tune sensitivity to your trading style or particular market behavior. Use in conjunction with other price action and volume indicators to confirm signals and improve trade timing.
This tool is ideal for traders aiming to spot footprint-like manipulations in volume delta, aiding in the detection of institutional activity and potential market turning points.

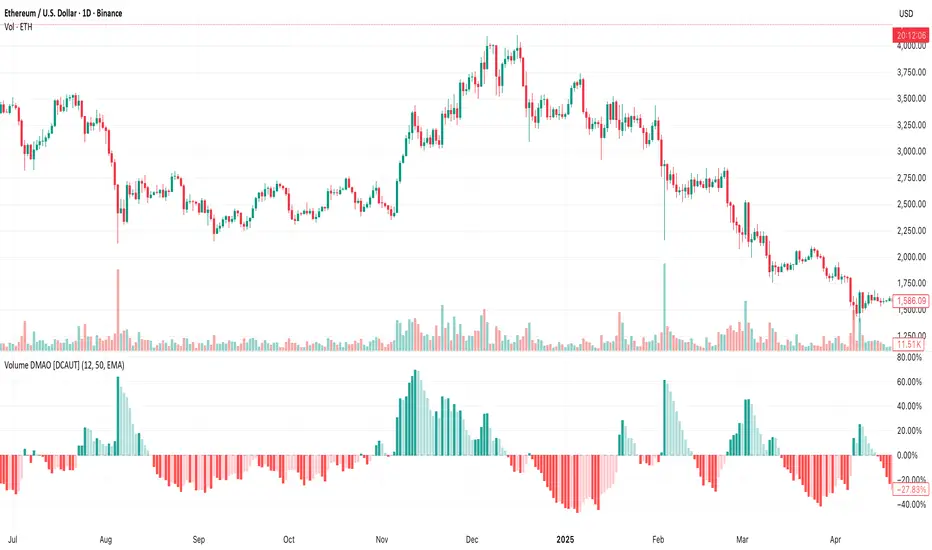
Volume DMAO [DCAUT]█ Volume DMAO Indicator
📊 OVERVIEW
The Volume DMAO (Dual Moving Average Oscillator) applies PPO-style calculation to volume data rather than price. It measures the percentage difference between fast and slow moving averages of volume, providing insights into volume momentum and market participation trends.
🎯 CONCEPTS
Signal Interpretation
Positive Values : Current volume above historical average (expansion phase)
Negative Values : Current volume below historical average (contraction phase)
Rising Trend : Volume momentum accelerating (increasing participation)
Falling Trend : Volume momentum decelerating (decreasing participation)
Primary Applications
Volume Confirmation : Validate price movements with volume momentum analysis
Divergence Detection : Spot potential reversals when volume diverges from price
Trend Strength : Assess volume participation in price trends
Entry/Exit Signals : Time trades based on volume momentum shifts
📋 PARAMETER SETUP
Input Parameters
Fast Length : Period for fast moving average (default: 12)
Slow Length : Period for slow moving average (default: 50)
MA Type : Moving average algorithm (default: EMA)
📊 COLOR CODING
Histogram Colors
Dark Green : Positive and rising (strong volume expansion)
Light Green : Positive and falling (weakening volume expansion)
Light Red : Negative and rising (recovering from volume contraction)
Dark Red : Negative and falling (strong volume contraction)
💡 CORE VALUE
Unlike traditional volume indicators, Volume DMAO provides normalized percentage readings that:
- Enable comparison across different timeframes and instruments
- Reveal volume momentum changes before price movements
- Identify market phases through volume participation analysis
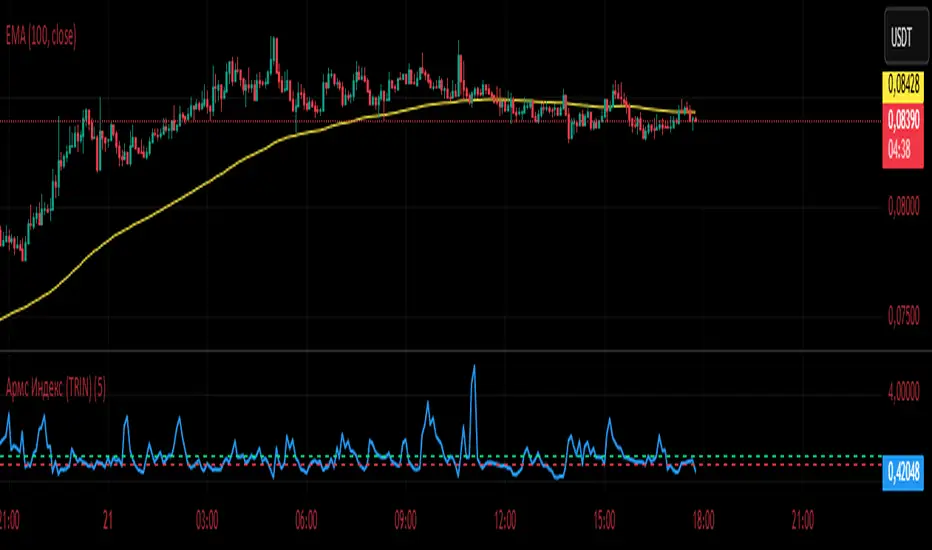
Армс Индекс (TRIN)
Arms Indicator (TRIN)
General description
This indicator is designed to visualize the overbought and oversold levels of the stock market. The Arms Index (TRIN) evaluates the ratio of the number of rising and falling stocks to the corresponding ratio of the trading volume of rising and falling stocks. The lower the TRIN indicator, the more overbought the market is, and vice versa — a high TRIN indicates oversold conditions.
How to interpret the signal?
- Zone below 0.8: The market is overbought, and a downward correction is likely to follow soon.
- Zone above 1.2: The market is oversold, an upward reversal is possible.
These zones help to identify entry and exit points in a timely manner, optimizing trading decisions.
Implementation features
1. Calculation method: The classic TRIN formula is based on the ratio of volume indicators of rising and falling assets.
2. Averaging interval: A moving average (MA) is used with a configurable default period of five days. The user can change this value manually.
3. Level display: The chart shows two key levels: the oversold (1.2) and overbought (0.8) lines. These lines are guidelines for decision-making.
Instructions for use
1. Upload the indicator to the chart of your financial instrument.
2. Keep an eye on the TRIN value: does it cross the critical levels (1.2 and 0.8)?
3. Use the TRIN readings as an additional filter to confirm the signal of your main strategies.
Remember that the Arms index is best used in conjunction with other technical analysis indicators to achieve maximum signal accuracy.
---
I hope this implementation will help you to trade more efficiently and find the best opportunities in the market!
© The authorship belongs to Eva-S-Apple.
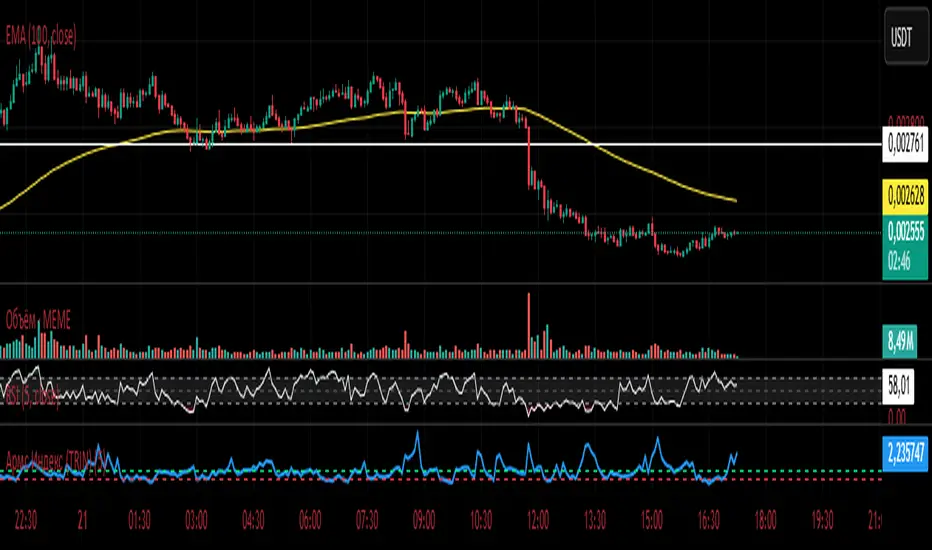
Армс Индекс (TRIN)Arms Indicator (TRIN)
General description
This indicator is designed to visualize the overbought and oversold levels of the stock market. The Arms Index (TRIN) evaluates the ratio of the number of rising and falling stocks to the corresponding ratio of the trading volume of rising and falling stocks. The lower the TRIN indicator, the more overbought the market is, and vice versa — a high TRIN indicates oversold conditions.
How to interpret the signal?
- Zone below 0.8: The market is overbought, and a downward correction is likely to follow soon.
- Zone above 1.2: The market is oversold, an upward reversal is possible.
These zones help to identify entry and exit points in a timely manner, optimizing trading decisions.
Implementation features
1. Calculation method: The classic TRIN formula is based on the ratio of volume indicators of rising and falling assets.
2. Averaging interval: A moving average (MA) is used with a configurable default period of five days. The user can change this value manually.
3. Level display: The chart shows two key levels: the oversold (1.2) and overbought (0.8) lines. These lines are guidelines for decision-making.
Instructions for use
1. Upload the indicator to the chart of your financial instrument.
2. Keep an eye on the TRIN value: does it cross the critical levels (1.2 and 0.8)?
3. Use the TRIN readings as an additional filter to confirm the signal of your main strategies.
Remember that the Arms index is best used in conjunction with other technical analysis indicators to achieve maximum signal accuracy.
---
I hope this implementation will help you to trade more efficiently and find the best opportunities in the market!
© The authorship belongs to Eva-S-Apple.
Advanced Volume Profile Pro Delta + POC + VAH/VAL# Advanced Volume Profile Pro - Delta + POC + VAH/VAL Analysis System
## WHAT THIS SCRIPT DOES
This script creates a comprehensive volume profile analysis system that combines traditional volume-at-price distribution with delta volume calculations, Point of Control (POC) identification, and Value Area (VAH/VAL) analysis. Unlike standard volume indicators that show only total volume over time, this script analyzes volume distribution across price levels and estimates buying vs selling pressure using multiple calculation methods to provide deeper market structure insights.
## WHY THIS COMBINATION IS ORIGINAL AND USEFUL
**The Problem Solved:** Traditional volume indicators show when volume occurs but not where price finds acceptance or rejection. Standalone volume profiles lack directional bias information, while basic delta calculations don't provide structural context. Traders need to understand both volume distribution AND directional sentiment at key price levels.
**The Solution:** This script implements an integrated approach that:
- Maps volume distribution across price levels using configurable row density
- Estimates delta (buying vs selling pressure) using three different methodologies
- Identifies Point of Control (highest volume price level) for key support/resistance
- Calculates Value Area boundaries where 70% of volume traded
- Provides real-time alerts for key level interactions and volume imbalances
**Unique Features:**
1. **Developing POC Visualization**: Real-time tracking of Point of Control migration throughout the session via blue dotted trail, revealing institutional accumulation/distribution patterns before they complete
2. **Multi-Method Delta Calculation**: Price Action-based, Bid/Ask estimation, and Cumulative methods for different market conditions
3. **Adaptive Timeframe System**: Auto-adjusts calculation parameters based on chart timeframe for optimal performance
4. **Flexible Profile Types**: N Bars Back (precise control), Days Back (calendar-based), and Session-based analysis modes
5. **Advanced Imbalance Detection**: Identifies and highlights significant buying/selling imbalances with configurable thresholds
6. **Comprehensive Alert System**: Monitors POC touches, Value Area entry/exit, and major volume imbalances
## HOW THE SCRIPT WORKS TECHNICALLY
### Core Volume Profile Methodology:
**1. Price Level Distribution:**
- Divides price range into user-defined rows (10-50 configurable)
- Calculates row height: `(Highest Price - Lowest Price) / Number of Rows`
- Distributes each bar's volume across price levels it touched proportionally
**2. Delta Volume Calculation Methods:**
**Price Action Method:**
```
Price Range = High - Low
Buy Pressure = (Close - Low) / Price Range
Sell Pressure = (High - Close) / Price Range
Buy Volume = Total Volume × Buy Pressure
Sell Volume = Total Volume × Sell Pressure
Delta = Buy Volume - Sell Volume
```
**Bid/Ask Estimation Method:**
```
Average Price = (High + Low + Close) / 3
Buy Volume = Close > Average ? Volume × 0.6 : Volume × 0.4
Sell Volume = Total Volume - Buy Volume
```
**Cumulative Method:**
```
Buy Volume = Close > Open ? Volume : Volume × 0.3
Sell Volume = Close ≤ Open ? Volume : Volume × 0.3
```
**3. Point of Control (POC) Identification:**
- Scans all price levels to find maximum volume concentration
- POC represents the price level with highest trading activity
- Acts as significant support/resistance level
- **Developing POC Feature**: Tracks POC evolution in real-time via blue dotted trail, showing how institutional interest migrates throughout the session. Upward POC migration indicates accumulation patterns, downward migration suggests distribution, providing early trend signals before price confirmation.
**4. Value Area Calculation:**
- Starts from POC and expands up/down to encompass 70% of total volume
- VAH (Value Area High): Upper boundary of value area
- VAL (Value Area Low): Lower boundary of value area
- Expansion algorithm prioritizes direction with higher volume
**5. Adaptive Range Selection:**
Based on profile type and timeframe optimization:
- **N Bars Back**: Fixed lookback period with performance optimization (20-500 bars)
- **Days Back**: Calendar-based analysis with automatic timeframe adjustment (1-365 days)
- **Session**: Current trading session or custom session times
### Performance Optimization Features:
- **Sampling Algorithm**: Reduces calculation load on large datasets while maintaining accuracy
- **Memory Management**: Clears previous drawings to prevent performance degradation
- **Safety Constraints**: Prevents excessive memory usage with configurable limits
## HOW TO USE THIS SCRIPT
### Initial Setup:
1. **Profile Configuration**: Select profile type based on trading style:
- N Bars Back: Precise control over data range
- Days Back: Intuitive calendar-based analysis
- Session: Real-time session development
2. **Row Density**: Set number of rows (30 default) - more rows = higher resolution, slower performance
3. **Delta Method**: Choose calculation method based on market type:
- Price Action: Best for trending markets
- Bid/Ask Estimate: Good for ranging markets
- Cumulative: Smoothed approach for volatile markets
4. **Visual Settings**: Configure colors, position (left/right), and display options
### Reading the Profile:
**Volume Bars:**
- **Length**: Represents relative volume at that price level
- **Color**: Green = net buying pressure, Red = net selling pressure
- **Intensity**: Darker colors indicate volume imbalances above threshold
**Key Levels:**
- **POC (Blue Line)**: Highest volume price - major support/resistance
- **VAH (Purple Dashed)**: Value Area High - upper boundary of fair value
- **VAL (Orange Dashed)**: Value Area Low - lower boundary of fair value
- **Value Area Fill**: Shaded region showing main trading range
**Developing POC Trail:**
- **Blue Dotted Lines**: Show real-time POC evolution throughout the session
- **Migration Patterns**: Upward trail indicates bullish accumulation, downward trail suggests bearish distribution
- **Early Signals**: POC movement often precedes price movement, providing advance warning of institutional activity
- **Institutional Footprints**: Reveals where smart money concentrated volume before final POC establishment
### Trading Applications:
**Support/Resistance Analysis:**
- POC acts as magnetic price level - expect reactions
- VAH/VAL provide intermediate support/resistance levels
- Profile edges show areas of low volume acceptance
**Developing POC Analysis:**
- **Upward Migration**: POC moving higher = institutional accumulation, bullish bias
- **Downward Migration**: POC moving lower = institutional distribution, bearish bias
- **Stable POC**: Tight clustering = balanced market, range-bound conditions
- **Early Trend Detection**: POC direction change often precedes price breakouts
**Entry Strategies:**
- Buy at VAL with POC as target (in uptrends)
- Sell at VAH with POC as target (in downtrends)
- Breakout plays above/below profile extremes
**Volume Imbalance Trading:**
- Strong buying imbalance (>60% threshold) suggests continued upward pressure
- Strong selling imbalance suggests continued downward pressure
- Imbalances near key levels provide high-probability setups
**Multi-Timeframe Context:**
- Use higher timeframe profiles for major levels
- Lower timeframe profiles for precise entries
- Session profiles for intraday trading structure
## SCRIPT SETTINGS EXPLANATION
### Volume Profile Settings:
- **Profile Type**: Determines data range for calculation
- N Bars Back: Exact number of bars (20-500 range)
- Days Back: Calendar days with timeframe adaptation (1-365 days)
- Session: Trading session-based (intraday focus)
- **Number of Rows**: Profile resolution (10-50 range)
- **Profile Width**: Visual width as chart percentage (10-50%)
- **Value Area %**: Volume percentage for VA calculation (50-90%, 70% standard)
- **Auto-Adjust**: Automatically optimizes for different timeframes
### Delta Volume Settings:
- **Show Delta Volume**: Enable/disable delta calculations
- **Delta Calculation Method**: Choose methodology based on market conditions
- **Highlight Imbalances**: Visual emphasis for significant volume imbalances
- **Imbalance Threshold**: Percentage for imbalance detection (50-90%)
### Session Settings:
- **Session Type**: Daily, Weekly, Monthly, or Custom periods
- **Custom Session Time**: Define specific trading hours
- **Previous Sessions**: Number of historical sessions to display
### Days Back Settings:
- **Lookback Days**: Number of calendar days to analyze (1-365)
- **Automatic Calculation**: Script automatically converts days to bars based on timeframe:
- Intraday: Accounts for 6.5 trading hours per day
- Daily: 1 bar per day
- Weekly/Monthly: Proportional adjustment
### N Bars Back Settings:
- **Lookback Bars**: Exact number of bars to analyze (20-500)
- **Precise Control**: Best for systematic analysis and backtesting
### Visual Customization:
- **Colors**: Bullish (green), Bearish (red), and level colors
- **Profile Position**: Left or Right side of chart
- **Profile Offset**: Distance from current price action
- **Labels**: Show/hide level labels and values
- **Smooth Profile Bars**: Enhanced visual appearance
### Alert Configuration:
- **POC Touch**: Alerts when price interacts with Point of Control
- **VA Entry/Exit**: Alerts for Value Area boundary interactions
- **Major Imbalance**: Alerts for significant volume imbalances
## VISUAL FEATURES
### Profile Display:
- **Horizontal Bars**: Volume distribution across price levels
- **Color Coding**: Delta-based coloring for directional bias
- **Smooth Rendering**: Optional smoothing for cleaner appearance
- **Transparency**: Configurable opacity for chart readability
### Level Lines:
- **POC**: Solid blue line with optional label
- **VAH/VAL**: Dashed colored lines with value displays
- **Extension**: Lines extend across relevant time periods
- **Value Area Fill**: Optional shaded region between VAH/VAL
### Information Table:
- **Current Values**: Real-time POC, VAH, VAL prices
- **VA Range**: Value Area width calculation
- **Positioning**: Multiple table positions available
- **Text Sizing**: Adjustable for different screen sizes
## IMPORTANT USAGE NOTES
**Realistic Expectations:**
- Volume profile analysis provides structural context, not trading signals
- Delta calculations are estimations based on price action, not actual order flow
- Past volume distribution does not guarantee future price behavior
- Combine with other analysis methods for comprehensive market view
**Best Practices:**
- Use appropriate profile types for your trading style:
- Day Trading: Session or Days Back (1-5 days)
- Swing Trading: Days Back (10-30 days) or N Bars Back
- Position Trading: Days Back (60-180 days)
- Consider market context (trending vs ranging conditions)
- Verify key levels with additional technical analysis
- Monitor profile development for changing market structure
**Performance Considerations:**
- Higher row counts increase calculation complexity
- Large lookback periods may affect chart performance
- Auto-adjust feature optimizes for most use cases
- Consider using session profiles for intraday efficiency
**Limitations:**
- Delta calculations are estimations, not actual transaction data
- Profile accuracy depends on available price/volume history
- Effectiveness varies across different instruments and market conditions
- Requires understanding of volume profile concepts for optimal use
**Data Requirements:**
- Requires volume data for accurate calculations
- Works best on liquid instruments with consistent volume
- May be less effective on very low volume or exotic instruments
This script serves as a comprehensive volume analysis tool for traders who need detailed market structure information with integrated directional bias analysis and real-time POC development tracking for informed trading decisions.

Exchanges Combined Volume📊 Exchanges Combined Volume
(Aggregated Multi-Exchange Volume: Binance, OKX, Bybit, etc.) by BIGTAKER*
🔍 Purpose
The Exchanges Combined Volume indicator aggregates real-time trading volumes from multiple global exchanges for a specific asset (e.g., a cryptocurrency).
Instead of relying on a single market, it provides a broader view of market activity, helping users detect abnormal volume behavior and increased participation across the entire market.
⚙️ Supported Exchanges
* USDT Markets
`Binance`, `OKX`, `Bybit`, `Bitget`, `Gate.io`
* USD Markets
`Coinbase`, `Bitfinex`, `Bitstamp`
* Default
Includes the current chart symbol’s native volume by default.
🧮 Core Calculation Logic
1. 📛 Symbol Normalization (cleanSymbol)
Prefixes such as `1000`, `10000`, `100000`, or `1M` (common in leveraged tickers) are automatically removed to extract the base token.
> Example:
> `1000PEPEUSDT` → `PEPEUSDT`
2. 📈 Volume Requests from External Exchanges
Volume is retrieved using the `` format (e.g., `'BINANCE:PEPEUSDT'`, `'COINBASE:BTCUSD'`).
Invalid or delisted pairs are safely ignored using `ignore_invalid_symbol=true`.
3. 📊 Total Volume Calculation
totalVolume = usdtVolume + usdVolume + currentSymbolVolume
The indicator sums the volume from all target exchanges plus the volume from the current chart symbol.
4. 📏 Comparison to Average Volume
* Period: `length = 60` (Simple Moving Average over 60 candles)
* A candle is considered **high-intensity** if:
5. 🎨 Visual Styling
| Condition | Color | Meaning |
| -------------------------- | --------------------- | ----------------------- |
| High-volume Bullish Candle | Light Green (#30db78) | Strong Buying Activity |
| High-volume Bearish Candle | Bright Red (#ff0000) | Strong Selling Activity |
| Normal Bullish Candle | Dark Green (#3c7058) | Regular Buying Volume |
| Normal Bearish Candle | Dark Red (#682e2c) | Regular Selling Volume |
📌 Use Cases
* Detect synchronized volume surges across major global exchanges.
* Identify pre-pump accumulation phases on altcoins.
* Combine with premium gap indicators (e.g., Kimchi Premium) to identify leading market sentiment.
* Confirm breakout momentum with multi-exchange volume validation.
📘 Notes & Warnings
* Listing differences across exchanges may result in **zero volume** on some platforms.
* Prefixes like `1000`, `1M`, etc., are automatically removed to **improve symbol matching accuracy**.
* As volume units are not standardized, this indicator is best suited for **absolute value analysis**, not ratio-based comparisons.

Intelligent Top & Bottom Finder v9.8 Keyvankh📈 Intelligent Top & Bottom Finder v9.8 Keyvankh
A next-generation all-in-one trading system for precise tops, bottoms, and reversals across all timeframes.
---
🟢 Overview
This indicator is a powerful and intelligent solution for detecting market tops and bottoms, key reversals, and S/R zones with institutional-grade accuracy. Designed for traders seeking an edge in any market (crypto, forex, stocks), it combines advanced candlestick recognition, multi-indicator confirmation, smart support/resistance clustering, and strict signal filtering into one seamless tool.
---
🔎 How Does It Work?
1. Advanced Support & Resistance Clustering
Automatically detects and draws high-probability support and resistance zones using dynamic ATR-based pivot clustering.
Highlights breakouts and retest (flip) zones in real-time, adapting to changing market structure.
2. Full Candlestick Pattern Recognition
Scans for 15+ classic and advanced patterns: Engulfing, Pin Bar, Doji, Three Bar, Marubozu, Hammer, Shooting Star, Three White Soldiers, Three Black Crows, Tweezer, Morning/Evening Star, Kicker, Belt Hold, and more.
Scores each pattern’s strength based on location (S/R zone, retest, breakout), volume context, and confirmation signals.
3. Multi-Indicator Confirmation Engine**
Integrates and scores confirmation from up to five additional sources:
RSI Games 1.2** (smoothed LTF momentum shifts)
MACD Divergence** (bullish/bearish momentum reversal)
QQE+ v7 Advanced** (dynamic volatility filter)
OBV Trend Filter** (volume-backed trend validation)
Volume Game** (net volume spike and reversal detection)
Each module can be enabled or disabled to fit your personal trading style.
4. Institutional S/R and Retest Logic
Real-time recognition of major trendline breaks, retest zones, and price flips.
Automatic labeling and coloring of S/R zones, retest boxes, and confirmation candles.
5. Smart Buy & Sell Signal Generation**
Combines all scoring modules with strict logical filters and “failsafe override” logic (guaranteeing signal on confirmed hammers, engulfings, etc. even if other filters disagree).
Plots clear “BUY” and “SELL” labels only when a strong, multi-factor signal appears—minimizing noise and maximizing reliability.
Built-in fallback logic (optional) for edge cases.
6. Alerts & Automation Ready
TradingView alerts for all BUY, SELL, or ANY signal conditions—perfect for auto-trading or notification setups.
---
*⚙️ Customizable Inputs
Enable/Disable any module (RSI Games, MACD, OBV, QQE+, Candlestick Scanner, Volume Game)
Minimum Confirmations** required for a signal (1–10)
Pivot/Zone Sensitivity:** ATR multiplier, pivots per cluster, retest bar duration
LTF (Lower Timeframe) Confirmation:** Fully configurable
---
📊 How To Use**
Apply on any timeframe and symbol**—crypto, stocks, forex, indices.
Use as a **standalone reversal/entry tool** or to confirm your own technical setups.
Combine with your favorite momentum, trend, or volume indicators for advanced confluence.
Set up **TradingView alerts** for auto-trading, Telegram/email notifications, or trade journaling.
---
🟢 What Makes This Unique?
All-in-one multi-indicator fusion:** No more juggling a dozen scripts.
Institutional logic:** Goes beyond basic signals with true S/R, retest, and volume logic.
Full transparency:** Source code is clear and commented (if published open-source).
Fast and reliable:** Optimized for minimal lag and maximum accuracy.
---
⚠️ Disclaimer**
This indicator is a tool to assist with trade timing and risk management. **No system is 100% accurate.** Always use in conjunction with your own analysis and risk management practices.
---
📚 Credits & License**
Created by Keyvan Khodakhah.
You may use, modify, or share this script under the (mozilla.org).
Please credit the original author if you fork or reuse in public.
---
Questions, feedback, or collaboration? Contact: Keyvankh
---
Precision in technical analysis comes from layers of confluence and discipline. This tool brings that precision to your chart.

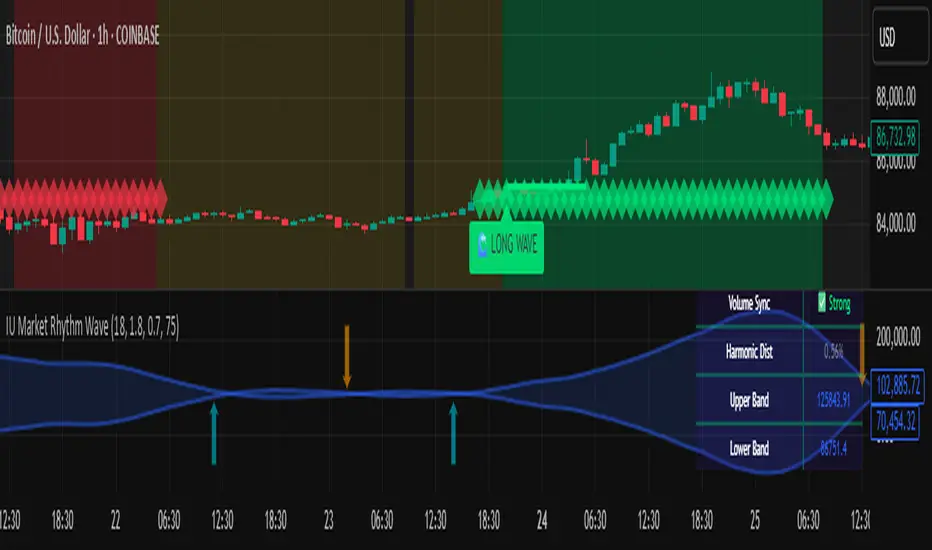
IU Market Rhythm WaveDESCRIPTION:
The IU Market Rhythm Wave is a multi-dimensional indicator designed to reveal the underlying rhythm and energy of the market. By analyzing price momentum, harmonic oscillations, volume behavior, and market breadth, it helps traders identify high-quality long and short wave signals. It also visualizes rhythm bands, wave strength zones, and harmonic levels to provide comprehensive context for decision-making.
This tool is best used on trending instruments where rhythm cycles and volume patterns create clear wave-based opportunities.
USER INPUTS:
Rhythm Cycle Length
Controls the main lookback period used to calculate price waves, harmonic oscillation, volume rhythm, and breath. A longer cycle smooths signals, while a shorter cycle makes them more responsive. Recommended range: 8 to 35.
Wave Signal Strength
Multiplies the standard deviation of rhythm to define dynamic breakout thresholds. A higher value results in fewer but stronger signals, filtering out minor fluctuations.
Harmonic Filter
Applies a sensitivity filter to the harmonic mean and standard deviation. It helps eliminate weak or noisy signals and ensures rhythm-based signals align with harmonic structure.
Show Wave Energy Zones
Toggles background color shading based on current rhythm conditions. Greenish zones indicate strong upward rhythm, red for strong downward rhythm, yellow for positive bias, and gray for weak or neutral zones.
Show Rhythm Bands
Enables the display of upper and lower rhythm bands derived from ATR and rhythm volatility. These bands act as dynamic price envelopes and potential support/resistance zones.
Wave Zone Opacity
Adjusts the transparency of background energy zones, allowing users to control how prominent these zones appear on the chart. Range: 60 to 90 for optimal visibility.
INDICATOR LOGIC:
The indicator combines multiple rhythmic components into a composite rhythm score:
1. Price Wave – Based on momentum (rate of price change) smoothed by a moving average.
2. Harmonic Oscillation – Measures how far price has deviated from a central harmonic average (HLC3).
3. Volume Rhythm – Uses volume’s deviation from its mean, standardized by its volatility.
4. Market Breath – Captures range expansion and closing strength relative to range.
These elements form the Raw Rhythm, which is further smoothed to produce the Market Rhythm. When the rhythm exceeds statistically calculated thresholds and other conditions like volume confirmation and harmonic proximity are met, wave signals are triggered.
Harmonic Fibonacci levels (0.236, 0.382, 0.618, 0.764) are also calculated every rhythm cycle to identify nearby structural price zones. Signals occurring near these levels are considered more reliable.
The Rhythm Bands use ATR and rhythm strength to define dynamic boundaries above and below price. Visual zones and arrows mark rhythm shifts and highlight the underlying energy of the market.
WHY IT IS UNIQUE:
This indicator goes beyond traditional oscillators or volume indicators by blending multiple market dimensions into one rhythmic framework. It adapts to volatility, applies harmonic structure awareness, and filters signals based on real-time market conditions. It offers:
* A unique rhythm-based view of price, volume, and volatility
* Dynamic, adaptive signal generation and zone coloring
* Visual analytics and contextual data in a summary table
* Signal filtering using harmonic alignment and market breath
Its real-time responsiveness and multi-layered logic make it suitable for intraday, swing, and positional traders.
HOW USER CAN BENEFIT FROM IT:
* Spot high-conviction long or short entries when rhythm, volume, and structure align
* Avoid low-quality trades during weak or noisy rhythm periods
* Use visual wave zones to gauge trend strength and rhythm direction
* Monitor harmonic proximity to enter or exit near key structural levels
* Apply rhythm bands for dynamic stop-loss and target setting
* Use rhythm direction arrows and analytics table to gain deeper market insight
DISCLAIMER:
This indicator is created for educational and informational purposes only. It does not constitute financial advice or a recommendation to buy or sell any asset. All trading involves risk, and users should conduct their own analysis or consult with a qualified financial advisor before making any trading decisions. The creator is not responsible for any losses incurred through the use of this tool. Use at your own discretion.
OBV with MA & Bollinger Bands by Marius1032OBV with MA & Bollinger Bands by Marius1032
This script adds customizable moving averages and Bollinger Bands to the classic OBV (On Balance Volume) indicator. It helps identify volume-driven momentum and trend strength.
Features:
OBV-based trend tracking
Optional smoothing: SMA, EMA, RMA, WMA, VWMA
Optional Bollinger Bands with SMA
Potential Combinations and Trading Strategies:
Breakouts: Look for price breakouts from the Bollinger Bands, and confirm with a rising OBV for an uptrend or falling OBV for a downtrend.
Trend Reversals: When the price touches a Bollinger Band, examine the OBV for divergence. A bullish divergence (price lower low, OBV higher low) near the lower band could signal a reversal.
Volume Confirmation: Use OBV to confirm the strength of the trend indicated by Bollinger Bands. For example, if the BBs indicate an uptrend and OBV is also rising, it reinforces the bullish signal.
1. On-Balance Volume (OBV):
Purpose: OBV is a momentum indicator that uses volume flow to predict price movements.
Calculation: Volume is added on up days and subtracted on down days.
Interpretation: Rising OBV suggests potential upward price movement. Falling OBV suggests potential lower prices.
Divergence: Divergence between OBV and price can signal potential trend reversals.
2. Moving Average (MA):
Purpose: Moving Averages smooth price fluctuations and help identify trends.
Combination with OBV: Pairing OBV with MAs helps confirm trends and identify potential reversals. A crossover of the OBV line and its MA can signal a trend reversal or continuation.
3. Bollinger Bands (BB):
Purpose: BBs measure market volatility and help identify potential breakouts and trend reversals.
Structure: They consist of a moving average (typically 20-period) and two standard deviation bands.
Combination with OBV: Combining BBs with OBV allows for a multifaceted approach to market analysis. For example, a stock hitting the lower BB with a rising OBV could indicate accumulation and a potential upward reversal.
Created by: Marius1032

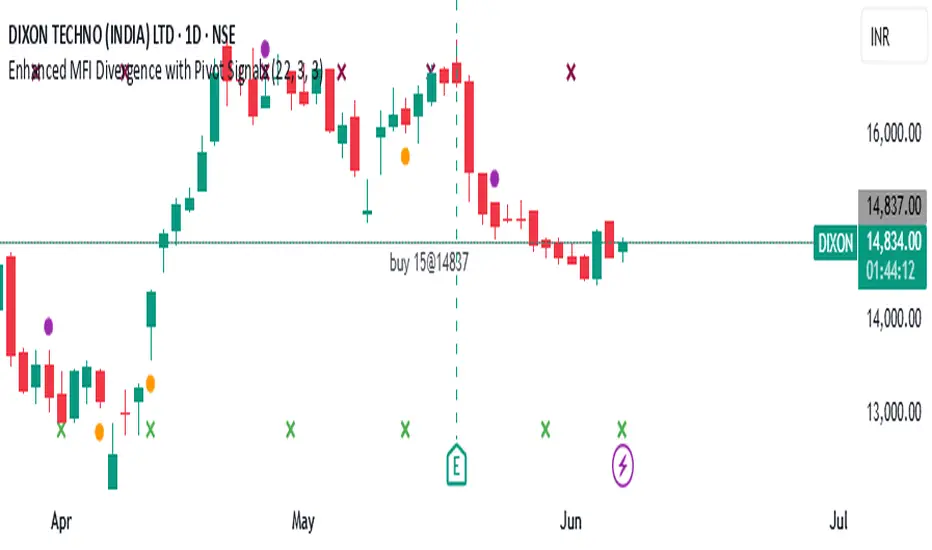
Enhanced MFI Divergence with Pivot SignalsEnhanced MFI Divergence with Pivot Signals
This custom Pine Script indicator identifies bullish and bearish divergences between price action and the Money Flow Index (MFI), enhancing the trader's ability to spot potential reversal zones with visual clarity and optional confirmation filters.
📊 Key Features:
🔹 MFI Divergence Detection
The script detects:
Bullish divergence when price forms a lower low but MFI forms a higher low.
Bearish divergence when price forms a higher high but MFI forms a lower high.
🔹 Pivot-Based Logic
To ensure high-confidence signals, the script uses pivot point logic to mark local highs and lows on both price and MFI. This avoids noise and focuses only on meaningful swing points.
🔹 Optional Confirmation Filter
You can enable a filter that checks if MFI is above 50 during bullish divergence (implying buying pressure) and below 50 for bearish divergence (implying selling pressure), adding an extra layer of confirmation.
🔹 Signal Markers
Signals are visually displayed on the chart using colored triangles:
Green triangle up for bullish divergence
Red triangle down for bearish divergence
🔹 Background Color Shading
The background is optionally shaded green or red based on MFI’s relationship to its smoothed WMA, helping you visually interpret trend bias.
🔹 Pivot Point Debugging Tools
Circles and crosses mark pivot points on price and MFI for debugging and visual clarity.
🔹 Alerts Ready
Real-time alerts notify you instantly when a bullish or bearish MFI divergence occurs, allowing for quick decision-making.
⚙️ How It Helps
This indicator is designed to help traders:
Anticipate price reversals by identifying hidden strength or weakness in momentum,
Avoid false breakouts,
Confirm entries or exits based on volume-weighted momentum divergence.
It works especially well when used alongside trend-following tools like moving averages, support/resistance zones, or additional volume indicators.